


Background
The forecast software was invented at one of the Polish University of technology according to the client’s guidelines. Our task was to create more efficient integration among the data presentation service, the forecast software and the client’s database, which we had a limited access to.
In most of our projects realized with Django we use an excellent, relational database PostgreSQL, which is the best one (or good enough) for most cases. In this project, we decided to use Postgres too.
The main task of the database was to store the data about products (ID, basic data and a lot of information about sale, supply and stock status) imported from the client’s database, which is synchronized weekly. Additionally, the database stores additional parameters for each product, important to the forecast software and its results.
Optimization by Design
The client expected to be able to take analysis in three possible aggregations: weekly, monthly and annually. Since the historical data was ten years long, we decided that forcing the database engine to count all the aggregations on the fly does not make sense. Once imported and aggregated historical data is immutable, so we do it when each new aggregation is imported and write them to different tables (one for aggregation).
We noticed that these data are rare type, i.e. for most products of one significant value (for example 5 sold items in this month) there were a few or a dozen next entries where there was no value (value was zero). That meant that for 15.000 all products under analysis we needed to add 15.000 entries for each period. That's almost one million entries yearly ((52 weeks + 12 months + 1-year aggregation) * 15.000) of which only some have real information. Ok, zero is also information, but it was simpler and more economical to recognize no value as value equal to zero.
The Problem
The data presentation application was like a table (the data was shown with the JavaScript framework, fetched from API). Each product was written in one row and particular information in the proper columns. Additionally, depending on a chosen period of time and aggregation - a series of columns with data about historical sales and sales forecasts. As simple as that - we added all the necessary fields into a serializer (Django REST Framework) dynamically, and DjangoORM base SQL query was extended automatically.
Unfortunately, the effect was disappointing. For each aggregation period the query looked as follows:
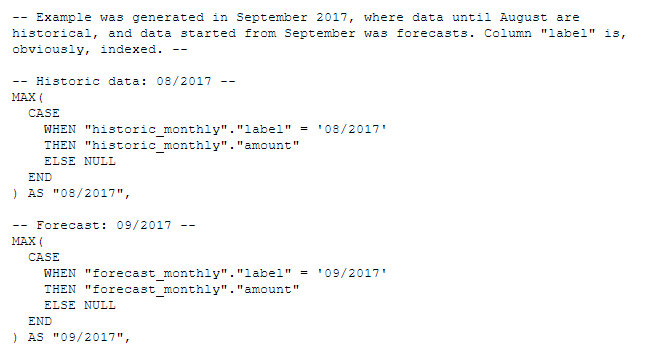
CASE-WHEN clause repeated for each period, for each product. The query, which contains 30 months (18 historical, 12 forecasts, by default) for one hundred products was generated in 42(!) seconds.
There would have been no problem if we had avoided design optimization and put all zero-entries into the database. But if we had switched back to this solution, we would have always needed to add zero value to all the historical periods with no entry (up to 10 years back). Moreover, if a new product had been added, we would have had to add entries starting from 2007. Millions of zeros!
No way, there must have been a better solution.
Solution
We first tried to optimize the query part added by the serializer, but without good results. All was always about more or less costly operations on each period in timespan for each product separately.
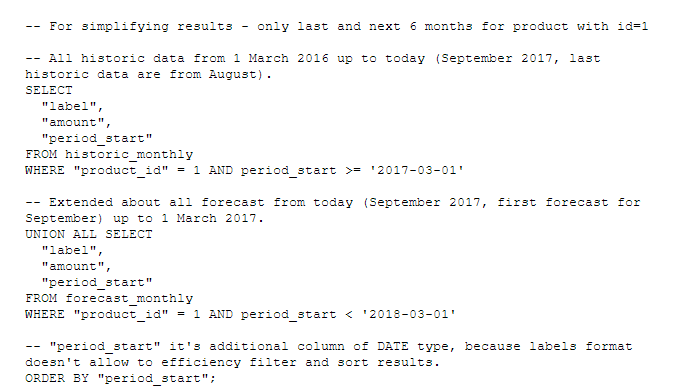
Then we tried to look at our problem from another side. Retrieving historical data and forecasts for one product from one timespan took only a few milliseconds.
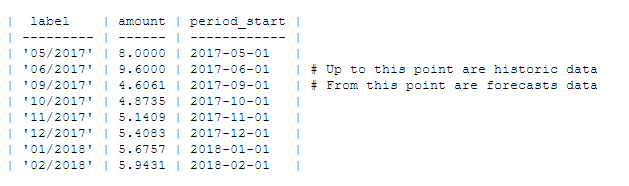
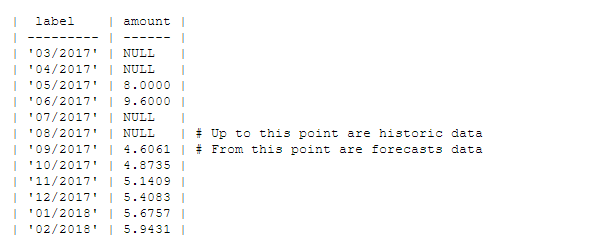
It results in the following table:
This table (and query) can be easily extended with missing labels by adding them as a temporary table and using a current query in LEFT OUTER JOIN. By adding a predefined ordering column (ord) - we can resign from the period_start column (subquery sorting takes no effect on the main query), but it is always a good idea to leave it in the WHERE clause subquery - the database engine will process smaller amount of data.
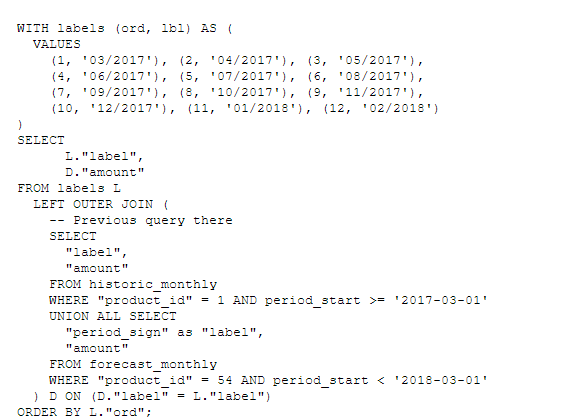
Thanks to it, we get a table filled up with empty labels where there is no data.
It's easy to see that this table, when to transpose it, will be perfect to use in JOIN for the main product query. Then, all the column label values will become separate columns with only one value (amount).
Obviously, Postgres has its own function for it. It's crosstab() from tablefunc module, which returns a pivoted table for a given query.
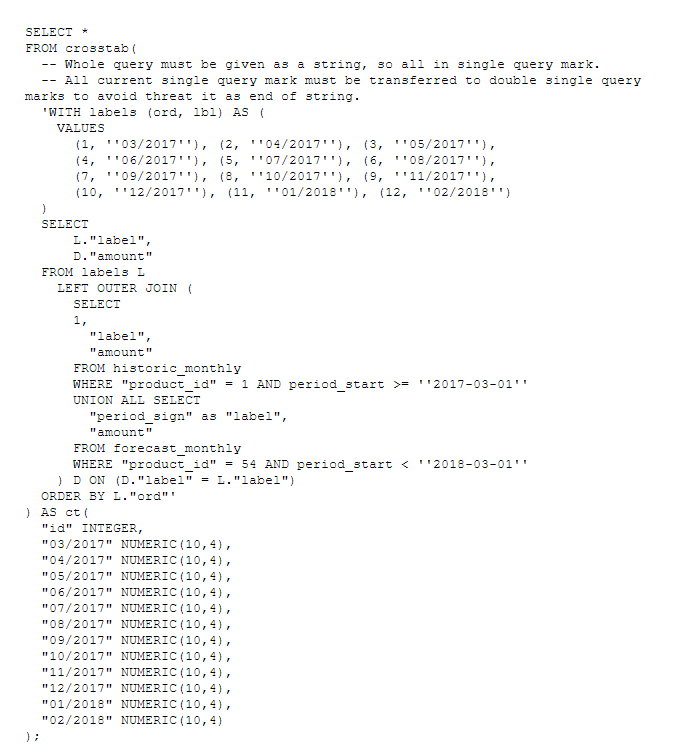
The crosstab() function takes one parameter with SQL query as string and returns a transformed table. There must be also used a row-formatter function (ct()), which has to contain an ID column definition and definitions for all the new columns. For this, we need to modify the previous query to return a single value (1) as first, which will be referred to as ID.
Alternatively, we can use two queries as an argument, the second containing the category list.
As a result, the following table will be produced (truncated for readability):
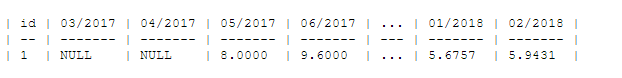
Now it is enough to use this id column as a vector to join results with the main product list query.
But there is one additional problem - the query is transferred to crosstab() as an immutable string and therefore, it will not adapt to each product row.
Fortunately, Postgres has a good solution for it - a format() function, which allows for using a variable in a string and JOIN LATERAL clause. That allows the subquery to reach the main query values.
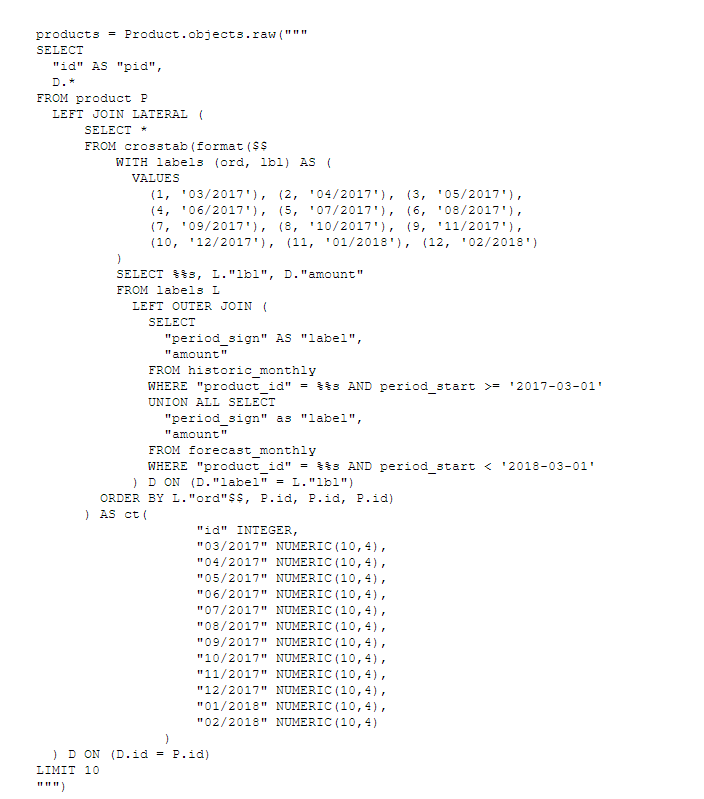
The final form of the query looks as follows:
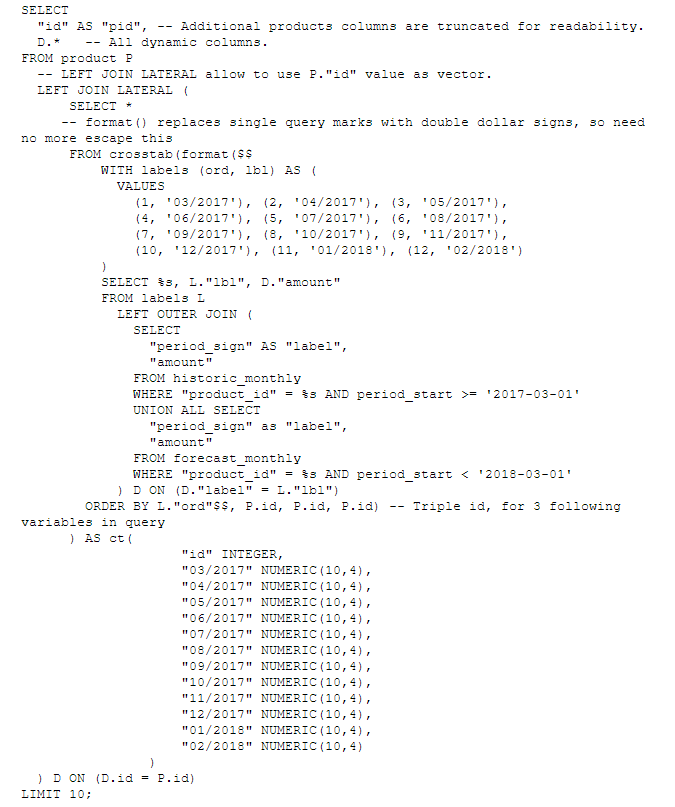
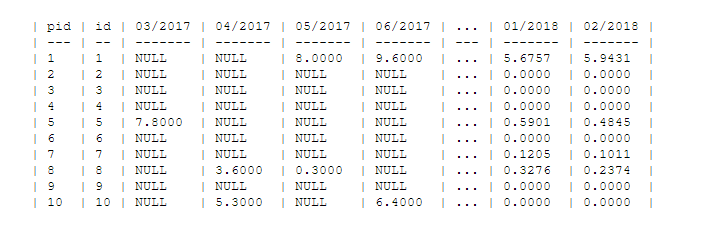
And there is a 10 result table:
SQL and ORM
The changes mentioned above in the ORM query were big enough to make us think about not using ORM in this application part anymore and fetching the data straight from the database. We didn’t do it because we had previously built quite a big and complicated logic in the serializer, which solved our client’s request about how to format the data in some special cases and rewriting it in another application part was not a good idea at that time.
We decided to use the Django ORM manager raw() function, which allows us to use a raw query. It will be returned as a python model object, where all the data are transferred to model attributes. We can simply put the list of these objects into the serializer, which adds all the logic defined before optimisations.
It’s worth noting that the previous query given as a string in the python code had to be changed a bit because strings which contain %s have special meaning in Python. To solve it, each %s had to be prepended with an additional %.
Summary
The further ORM generated query analysis allowed us to find some other ineffective fragments and some duplicated JOINS in different context which can be used as a single one. Thanks to the raw() function, we were able to optimise the whole query.
All these changes decreased the page loading time from 42 seconds to almost 2 seconds! which was a very good result for this amount of data and was acceptable for users.
Our client was happy with our work.


